· Kalpa Madhushan · systems programming · 3 min read
Mastering Debugging in C with GDB: Live Debugging and Core Dump Analysis
Learn how to debug C programs effectively using GDB, covering live debugging, breakpoints, registers, assembly inspection, and post-crash analysis with core dump files.
Mastering Debugging in C with GDB: From Live Debugging to Core Dump Analysis
Debugging is one of the most important skills for a systems programmer. Whether your program crashes unexpectedly or behaves incorrectly, GDB (GNU Debugger) gives you deep visibility into what your program is doing at runtime — down to registers and assembly instructions.
In this article, we’ll cover both live debugging and core dump debugging, and how to use GDB effectively in real-world scenarios.
🔧 1. Preparing Your Program for Debugging
Compile with debug symbols
Always compile your program with the -g flag:
gcc -g program.c -o programThis embeds debugging information such as:
- Source file names
- Line numbers
- Variable names
- Function names
Without -g, GDB can still run, but debugging will be painful and limited.
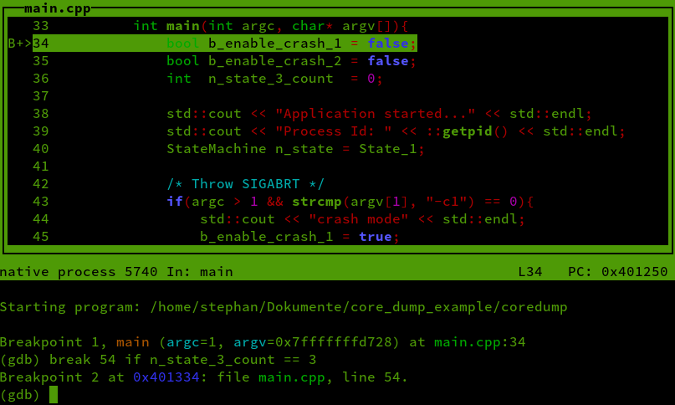
🧠 2. Debugging a Program Using GDB (Live Debugging)
Start GDB
gdb ./programInside GDB, your program is not running yet.
Set a breakpoint
Breakpoints stop execution at specific locations.
break mainYou can also break at:
break function_name
break file.c:42
Then start the program:
runStepping Through Code
Once execution stops:
| Command | Meaning |
|---|---|
next / n | Execute current line, step over functions |
step / s | Step into function calls |
continue / c | Resume execution |
finish | Run until current function returns |
If GDB pauses output, press Enter to continue.
🧩 3. Viewing Source, Assembly, and Registers
GDB allows mixed-level debugging.
Source and Assembly Views
layout src      # C source
layout asm      # Assembly
layout regs     # CPU registers
Switch layouts with:
layout nextInspecting Instructions
x/i $pcx→ examine memory/i→ instruction format$pc→ program counter (current instruction)
To see more instructions:
x/10i $pc🧠 4. Understanding CPU Registers (Critical Skill)
To view all registers:
info registersImportant x86-64 Registers
| Register | Purpose |
|---|---|
rip | Instruction pointer |
rsp | Stack pointer |
rbp | Frame/base pointer |
rax | Return value |
rdi, rsi, rdx, rcx, r8, r9 | Function arguments |
eflags | CPU flags |
Example: Segmentation Fault Analysis
If your program crashes and you see:
rip = 0x0It usually means: 👉 You jumped to a NULL pointer.
If rsp or rbp looks corrupted: 👉 Stack overflow or memory corruption likely occurred earlier.
🧨 5. Debugging with Core Dumps (Post-Crash Debugging)
Core dumps allow you to analyze a crash after the program has already terminated.
Enable core dumps
ulimit -c unlimitedSet core file pattern (optional)
echo "core" | sudo tee /proc/sys/kernel/core_patternThis creates a file named core in the working directory.
When is a core file generated?
Only when the program terminates due to fatal signals such as:
SIGSEGV(segmentation fault)SIGABRTSIGFPESIGILL
Normal exits or Ctrl+C do not generate core dumps.
Debugging a core file
gdb ./program coreThen use:
bt              # backtrace
info registers  # CPU state at crash
x/i $pc         # instruction that crashed
This allows you to debug crashes after the fact, even on production systems.
🧩 6. Typical Debugging Workflow
- Program crashes
- Load core file into GDB
- Inspect backtrace (
bt), or useupto go back step by step - Check registers and instruction pointer
- Identify corrupted data or invalid memory access
- Fix code and recompile
🧠 7. Pro Tips
Use
-O0during debugging (disable optimization)Combine with sanitizers:
gcc -g -fsanitize=address -O0 program.cLearn to read assembly — it greatly improves debugging skills
Core dumps are essential for production debugging